
Inferential statistics is the core of data analysis, whether with SPSS or any other platform. Statistical inference is tough and more complex than its descriptive counterpart. If you are working on a stat analysis assignment in SPSS, chances are high that you will need professional SPSS assignment help services. But no matter whether you avail of any aid or not, you won’t get far without clear ideas and a strong grasp. So, read on to learn the nuances of inferential statistics and its crucial role in SPSS analysis.
Inferential Statistics in SPSS
The outline of the major steps involved in SPSS analysis is as follows:
Stage 1: Exploring the Data
This stage involves cleaning it, identifying major variables, conducting descriptive analysis, and formulating an appropriate hypothesis.
Stage 2: In-Depth Analysis
This stage involves setting up a hypothesis and running inferential tests to uncover insights.
Stage 3: Interpreting Results
The results of inferential tests are interpreted, checked for significance, and then changing the hypothesis as per inference.
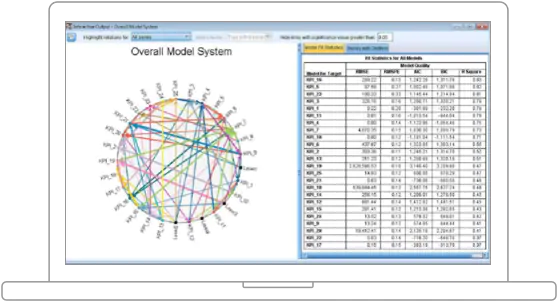
Now, SPSS provides numerous options for inferential analysis of any data. We don’t have the space to look into everyone but focus on two of the most commonly used ones. Read on to learn key insights and their role in SPSS statistical analysis.
Know that things will seem tougher if you have never used SPSS or know little about inferential statistics. If you need aid, look for reputed academic service providers that offer SPSS assignment help, SAS assignment help, statistics & programming assignment help, etc.
Inferring Information using Pearson Correlation
The Pearson Correlation Coefficient is a metric for determining the strength and direction of the correlation between two variables. In SPSS or any other analysis software, this coefficient checks for the existence and extent of a linear relationship between pairs of continuous variables as well as within & between variable sets.
Note that this correlation does not apply to variables with non-linear relationships. Also, the Pearson coefficient is a measure of association and does not provide any inference about the underlying causality.
The sample correlation coefficient is calculated with the following expression:
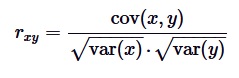
Where cov(x,y) is the sample covariance of both x and y, and var(x) & var(y) are the sample variance of x and y, respectively.
The sign and magnitude of r indicate the linear relationship’s direction/nature and magnitude. It can be 0, +1, or -1. 0 means no linear relationship, + 1 shows a direct linear relationship, while -1 indicates an inverse linear relationship. The nature of correlation is determined by whether the value of r is closer to +1 or -1.
Besides Pearson, SPSS allows you to determine correlation using Spearman Rho & Kendall’s tau-b coefficients.
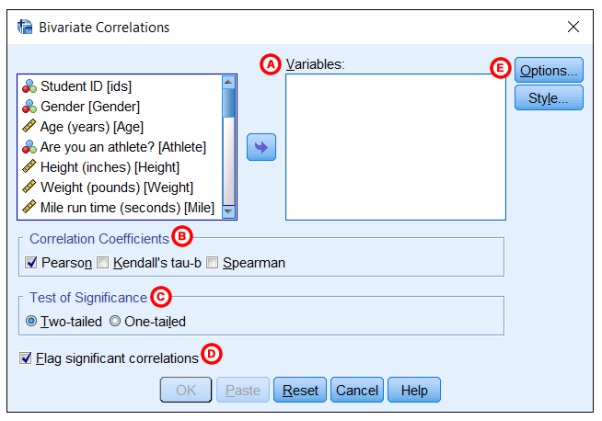
- To run a bivariate Pearson correlation analysis, go to Analyze àCorrelate à
- Move the concerned variables to the analysis window.
- Choose the Pearson Coefficient
- Select the test for significance that determines whether there is a significant correlation.
- There are also options for choosing any additional statistic to include in the analysis.
Here’s a look at the correlation pop-up window.
The Role of Hypothesis Testing in SPSS Analysis
Hypothesis testing is evaluating and subsequently reinforcing or dismissing a hypothesis on a statistic. Generally, hypothetical statements regarding an entire population are tested against sample observations to determine whether they hold.
SPSS allows both parametric & non-parametric tests as per the nature of the distribution. Below are the hypothesis tests in SPSS listed alongside the ideal situation for applying them.
- Parametric one Sample t-test or non-parametric one-sample Wilcoxon signed-rank test to check whether a sample comes from a population with a specific mean;
- Parametric paired-samples t-test or non-parametric Wilcoxon signed-rank test for comparing means of two linked groups
- Parametric independent samples t-test and non-parametric Mann-Whitney U test for two unrelated groups
- Parametric one-way Analysis of Variance (ANOVA) for comparing means for more than two unrelated groups and the non-parametric Kruskal-Wallis one-way ANOVA.
Well, that about wraps up this write-up. Dedicated practice is key to becoming better at statistics, so work hard and, if needed, look for assignment experts for SPSS.
All the best!
go to homepage